
For two years, Oregonians have been pulling over to photograph dead animals on the shoulder of the road. There are now more than 5,600 of those photographs, contributed by more than 890 people, and together they have given state biologists something they did not have before: a map of which animals are being killed by vehicles across Oregon, and where.
The Roadkills of Oregon project is a collaboration between the Oregon Department of Fish and Wildlife and the Oregon Zoo. It launched in 2024 with a deliberately low barrier to entry. Volunteers photograph what they find and submit it through the free iNaturalist app, and the records accumulate into something no agency survey had managed to assemble.
Why did the state need volunteers for this?
Because the official picture was skewed toward large animals. Transportation and wildlife agencies have always known a good deal about collisions involving deer and elk, which damage vehicles and get reported. Frogs and rabbits do not generate insurance claims.
“Thanks to these volunteers, we’re now seeing many of the other species that are being killed, and, importantly, where those deaths are occurring. Before this project, we had a very incomplete picture of what was happening on Oregon’s roads.”
That is Dr. Rachel Wheat, a wildlife connectivity biologist with the Oregon Department of Fish and Wildlife. The scale of what was missing is easy to understate: Oregon has the highest rate of wildlife-vehicle collisions on the West Coast, and an estimated 14.5 million animals die on the state’s roads every year.
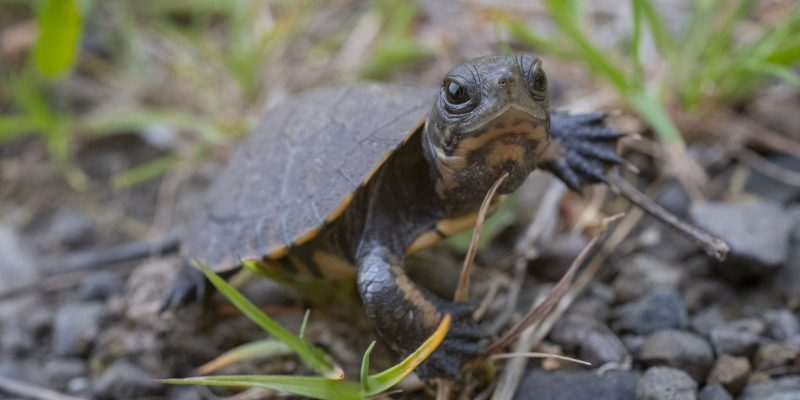
The species turning up most often in the data are not the ones most drivers would name. Porcupines, rough-skinned newts and five kinds of snake are among the most documented. Volunteers have also recorded 36 species that Oregon identifies as declining or of conservation concern, including marten, fisher, golden eagles and northwestern pond turtles.
“Most drivers are used to seeing larger animals like deer, skunks and raccoons, but don’t realize the tremendous impact of roadways on almost all of our wildlife species. Road mortality impacts hundreds of diverse species, of all sizes, across all roadways.”
Which list is this, exactly?
Oregon’s own. The 36 species above are flagged by the state as declining or of conservation concern, which is a different exercise from the IUCN Red List and answers a different question. Several of those animals are globally secure and locally in trouble at the same time: the Red List assesses the golden eagle, Aquila chrysaetos, and the rough-skinned newt, Taricha granulosa, as Least Concern worldwide, while the northwestern pond turtle, Actinemys marmorata, is Vulnerable.
That is not a contradiction and it is not a correction of anybody. A global category describes a species across its whole range; a state list describes what is happening inside one state’s borders, which is where roads and crossings actually get built. Naming which list a category came from is the only way both facts stay useful.
What the data is already being used for
Finding the places where a crossing structure would do the most good. Underpasses, overpasses and culverts built for wildlife work, but only in the right spot, and the right spot has historically been a matter of educated guessing.
“Crossing structures can save lives for wildlife and for people, but they only work if we put them in the right places. Some solutions are large and expensive, while others can be as simple as strategically placed plantings. The Roadkills of Oregon data can help us identify where action may have the greatest benefit.”
There is already a built example to point at. In the Portland area, red-legged frogs have to cross two roads and a set of railroad tracks to reach their breeding ponds, which is a hard ask for one of the last remaining populations of the amphibian in the city. In 2024 the Palensky Wildlife Underpass on U.S. Highway 30 became Oregon’s first amphibian underpass. Camera-trap monitoring over its first two years documented more than 33 species using it, including hundreds of red-legged frogs.
Thirty-three species is the number worth sitting with. A structure built with frogs in mind turned out to be used by almost everything else as well.
A zoo’s role in a highway problem
The Oregon Zoo’s contribution here is not an animal or an exhibit. It is the convening and the audience, and its conservation manager put the case for the project in one sentence.
“Every animal on the shoulder of the road is a data point we’ve been driving past for decades. It’s been amazing to see Oregonians from every corner of the state pull over and pay attention. Every photo fills in the map, and every observation points us toward a solution for protecting wildlife.”
That is Shervin Hess, conservation manager at the Oregon Zoo. The zoo and ODFW are both asking Oregonians to keep going; instructions for submitting records are on the department’s Roadkills of Oregon page, and the app is free.
It is a rare conservation project where the entry requirement is a phone and a willingness to stop the car. The map gets better every time somebody does.
Written from the Oregon Zoo’s report on the Roadkills of Oregon project, published 10 November 2026. For more from this zoo this month, see our report on its acquisition of the former Portland Children’s Museum property.
Quick answers
- What is the Roadkills of Oregon project?
A collaboration between the Oregon Department of Fish and Wildlife and the Oregon Zoo, launched in 2024, in which volunteers photograph roadkill and submit the records through the free iNaturalist app.
- How many animals die on Oregon's roads each year?
An estimated 14.5 million. Oregon has the highest rate of wildlife-vehicle collisions on the West Coast.
- Do wildlife underpasses actually work?
The Palensky Wildlife Underpass on U.S. Highway 30, Oregon's first amphibian underpass, was documented by camera traps being used by more than 33 species in its first two years, including hundreds of red-legged frogs.